8 - Vodka Sales
| dc.contributor.author | Lillestøl, Jostein | |
| dc.date.accessioned | 2018-06-07T13:57:00Z | |
| dc.date.available | 2018-06-07T13:57:00Z | |
| dc.date.issued | 2007-10-09 | |
| dc.identifier.uri | http://hdl.handle.net/11250/2500905 | |
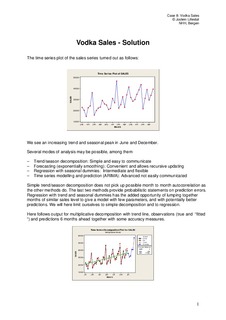
| dc.description.abstract | Topic: Time series analysis and prediction Context: A wholesale dealer of liquor has on record the sales each month of a certain brand of vodka for the period of July 2001 - June 2004. The data is available in the file Vodka_Sales.XLS in two columns: SALES (in litres) and MONTH (no.) Task: 1. Illustrate the sales in a time chart for this period. Comment on the main features? 2. Give a prognosis for the monthly sales for each month for the rest of year 2004. 3. Give a prognosis for the total sales for the rest of the year 2004. 4. Give your judgement on the uncertainty in each prognosis, if possible. 5. How about prognosis for 2005? | nb_NO |
| dc.language.iso | eng | nb_NO |
| dc.title | 8 - Vodka Sales | nb_NO |
| dc.type | Others | nb_NO |
Tilhørende fil(er)

Denne innførselen finnes i følgende samling(er)
-
Data analysis in practice: A case collection - by Jostein Lillestøl [21]
This is a case collection in data analysis containing cases mostly relevant for business studies.