| dc.description.abstract | Topic: Cluster analysis and alternatives
Context:
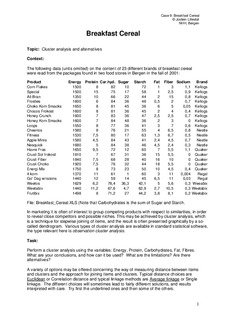
The following data (units omitted) on the content of 23 different brands of breakfast cereal were read from the packages found in two food stores in Bergen in the fall of 2001:
Product Energy Protein Car.hyd. Sugar Starch Fat Fiber Sodium Brand
Corn Flakes 1500 8 82 10 72 1 3 1,1 Kellogs
Special 1500 15 75 17 58 1 2,5 0,9 Kellogs
All-Bran 1350 10 66 22 44 2 15 0,8 Kellogs
Frosties 1600 6 84 36 48 0,5 2 0,7 Kellogs
Choko Korn Smacks 1650 8 81 45 36 6 5 0,05 Kellogs
Chocos Frokost 1600 8 81 36 45 2 4 0,4 Kellogs
Honey Crunch 1600 7 83 36 47 2,5 2,5 0,7 Kellogs
Honey Korn Smacks 1600 7 84 48 36 2 3 0 Kellogs
Loops 1550 8 77 36 41 3 7 0,6 Kellogs
Cheerios 1580 8 76 21 55 4 6,5 0,8 Nestle
Fitness 1530 7,5 80 17 63 1,3 6,7 0,5 Nestle
Apple Minis 1580 4,5 84 43 41 2,4 4,5 0,7 Nestle
Nesquick 1680 5 84 38 46 4,5 2,4 0,3 Nestle
Havre Fras 1650 9,5 72 12 60 7 5,5 1,1 Quaker
Crusli Sol frokost 1810 7 67 31 36 15 5,5 0 Quaker
Crusli Fiber 1840 7,5 68 28 40 16 10 0 Quaker
Crusli Choko 1920 7,5 76 32 44 18 5,5 0 Quaker
Energi Mix 1750 8 73 23 50 10 4,5 0,4 Quaker
4 korn 1370 11 61 1 60 3 11 0,004 Regal
Go' Dag w/raisins 1440 12 59 14 45 6,5 11 0,03 Regal
Weetos 1629 6,2 78,4 36,3 42,1 5 5,6 0,3 Weeabix
Weetabix 1440 11,2 67,6 4,7 62,9 2,7 10,5 0,3 Weetabix
Frutibix 1498 8 71,2 27 44,2 3,8 8,1 0,2 Weetabix
File: Breakfast_Cereal.XLS (Note that Carbohydrates is the sum of Sugar and Starch.
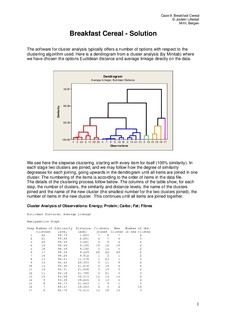
In marketing it is often of interest to group competing products with respect to similarities, in order to reveal close competitors and possible niches. This may be achieved by cluster analysis, which is a technique for stepwise joining of items, and the result is often presented graphically by a so-called dendrogram. Various types of cluster analysis are available in standard statistical software, the type relevant here is observation cluster analysis.
Task:
Perform a cluster analysis using the variables: Energy, Protein, Carbohydrates, Fat, Fibres.
What are your conclusions, and how can it be used? What are the limitations? Are there alternatives?
A variety of options may be offered concerning the way of measuring distance between items and clusters and the approach for joining items and clusters. Typical distance choices are Euclidean or Correlation distance and typical linkage methods are Average linkage or Single linkage. The different choices will sometimes lead to fairly different solutions, and results interpreted with care. Try first the underlined ones and then some of the others. | nb_NO |