| dc.description.abstract | Topic:
Multidimensional categorical and numerical variables - association and explanation
A civil service operates throughout the state and has a number of cars. Purchasing and maintenance are decentralized to 6 regions: Capital, East, South, West, Central and North. The running expenses, including maintenance and repair are recorded in a journal for each car. Each account is settled four times a year, at a fixed date every quarter, and then reported to the headquarter in the capital. The receiving officer wants to examine the operating costs for different car categories in different regions, and in particular the dependence on driving length and age of the car. The intention is that the findings should be used as input to replacement calculations. For an organization with more than 5000 vehicles state wide, such calculations may be of considerable economic significance.
For a preliminary analysis the officer decides to take a sample of 325 cars from his own region and survey the operating and repair costs last year, for each car in the sample. Operating costs include expenses for gasoline/diesel, oil, washing, routine maintenance and insurance. Repair costs include expenses for repair of damage and breakdown.
All cars are bought new, and there are three categories: sedan, station wagon and pick-up van. The data is available in the file Operating Expenses.XLS as follows:
District (1=Capital, 2=East, 3=South, 4=West, 5=Central, 6=North)
Car type (1=sedan, 2=station wagon, 3=pick-up van)
Age of car (in years)
Driving length (in km)
Operating costs (in local currency)
Repair costs (in local currency)
Question (A-version):
How will driving length and age and type car affect the two costs categories?
Try different modes of analysis: tabular, graphical and modelling of relations.
Questions (B-version):
Do each of the following tasks for both types of costs and successively reflect on what you learn, and may want to do next:
1. Categorize Age and Driving length in two categories.
Suggested coding: Age group (1=3 years or less, 2= over 3 years)
Driving length group (1=up to 20000 km, 2=over 20000km)
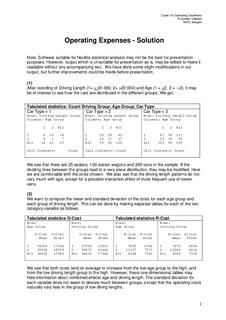
Make for each Car type 2x2 tables of counts for the coded variables for checking of reasonable coding.
2. Make 2x2 table(s) showing the average and standard deviation of Cost in terms of the categorized variables Age group and Driving length group.
Do this for each Car type as well.
3. Draw graphs to illustrate each of the two costs in terms of Driving length group. Repeat for Age. (Hint: Dotplot)
4. Draw graphs to illustrate each of the two costs in terms of the original variable Driving length. Repeat for Age. (Hint: Scatterplot).
5. Compute the pairwise correlations between the Cost, Driving length and Age.
Do the same separately for sedans. Do you see something that may affect the interpretation of findings above and further analysis?
6. Establish regression relationships where Cost is explained by Age, Driving length and Car Type | nb_NO |