| dc.description.abstract | Topic: Comparisons, regression and outliers
Context:
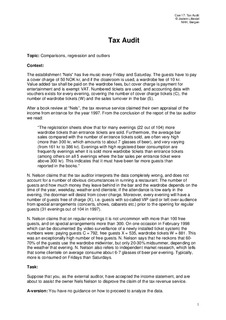
The establishment ”Nels” has live music every Friday and Saturday. The guests have to pay a cover charge of 50 NOK kr, and if the cloakroom is used, a wardrobe fee of 10 kr.
Value added tax shall be paid on the wardrobe fees, but cover charge is payment for entertainment and is exempt VAT. Numbered tickets are used, and accounting data with vouchers exists for every evening, covering the number of cover charge tickets (C), the number of wardrobe tickets (W) and the sales turnover in the bar (S).
After a book review at “Nels”, the tax revenue service claimed their own appraisal of the income from entrance for the year 1997. From the conclusion of the report of the tax auditor we read:
“The registration sheets show that for many evenings (22 out of 104) more wardrobe tickets than entrance tickets are sold. Furthermore, the average bar sales compared with the number of entrance tickets sold, are often very high (more than 300 kr, which amounts to about 7 glasses of beer), and very varying (from 161 kr to 386 kr). Evenings with high registered beer consumption are frequently evenings when it is sold more wardrobe tickets than entrance tickets (among others on all 5 evenings where the bar sales per entrance ticket were above 300 kr). This indicates that it must have been far more guests than reported in the books.”
N. Nelson claims that the tax auditor interprets the data completely wrong, and does not account for a number of obvious circumstances in running a restaurant: The number of guests and how much money they leave behind in the bar and the wardrobe depends on the time of the year, weekday, weather and clientele; if the attendance is low early in the evening, the doorman will desist from cover charge. Moreover, every evening will have a number of guests free of charge (X), i.e. guests with so-called VIP card or left over audience from special arrangements (concerts, shows, cabarets etc.) prior to the opening for regular guests (31 evenings out of 104 in 1997).
N. Nelson claims that on regular evenings it is not uncommon with more than 100 free guests, and on special arrangements more than 300. On one occasion in February 1998 which can be documented (by video surveillance of a newly installed ticket system) the numbers were: paying guests C = 792, free guests X = 535, wardrobe tickets W = 881. This was an exceptionally high number of free guests. N. Nelson says that he reckons that 60-70% of the guests use the wardrobe midwinter, but only 20-30% midsummer, depending on the weather that evening. N. Nelson also refers to independent market research, which tells that some clientele on average consume about 6-7 glasses of beer per evening. Typically, more is consumed on Fridays than Saturdays.
Task:
Suppose that you, as the external auditor, have accepted the income statement, and are about to assist the owner Nels Nelson to disprove the claim of the tax revenue service.
A-version: You have no guidance on how to proceed to analyze the data.
B-version: You have obtained the following suggestions on how to proceed:
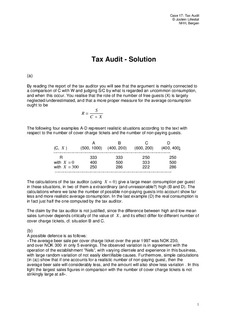
By reading the report of the tax auditor you will see that the argument is mainly connected to a comparison of C with W and judging S/C by what is regarded an uncommon consumption, and when this occur. You realise that the role of the number of free guests (X) is largely neglected/underestimated, and that a more proper measure for the average consumption ought to be
(a) Let S = 200 000 and compute R for the four cases
Compare this with what the tax auditor would get if he used a fixed X = 0 or X = 300.
Discuss the following claim of the tax auditor: “We regard here the number of free guests as constant, as this will not affect the judgement of the differences between high and low bar sales per guest”.
(b) Computer descriptive statistics for the variables S, C, W, S/C, W/C.
Use these results, your calculation in (a) and the information given, and try to argue that the registered number of guests C is reasonable compared to S and W.
(c) A simple regression analysis may be performed, where C is explained by S. One could consider the outliers and try to find argument for that they are not more frequent or larger than expected. Ask yourself also how extraordinary bar sales may affect the regression.
(d) To examine more closely the use of the wardrobe during the year, a regression is
may be performed where W/C is explained by month (0 – 1 variable for each month, with January as basis). One could provide a table with estimated percentages in each month and try to explain why they are misleading. These numbers may be corrected using the facts in the case description, and then decide whether the result supports the claim of N. Nelson concerning the use of the wardrobe. | nb_NO |


