| dc.description.abstract | Topic: Analysis of variance (ANOVA)
Context:
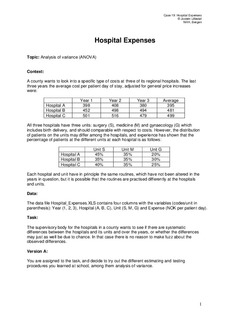
A county wants to look into a specific type of costs at three of its regional hospitals. The last three years the average cost per patient day of stay, adjusted for general price increases were:
Year 1 Year 2 Year 3 Average
Hospital A 398 408 380 395
Hospital B 452 498 494 481
Hospital C 501 516 479 499
All three hospitals have three units: surgery (S), medicine (M) and gynaecology (G) which includes birth delivery, and should comparable with respect to costs. However, the distribution of patients on the units may differ among the hospitals, and experience has shown that the percentage of patients at the different units at each hospital is as follows:
Unit S Unit M Unit G
Hospital A 45% 35% 20%
Hospital B 35% 35% 30%
Hospital C 40% 35% 25%
Each hospital and unit have in principle the same routines, which have not been altered in the years in question, but it is possible that the routines are practised differently at the hospitals and units.
Data:
The data file Hospital_Expenses.XLS contains four columns with the variables (codes/unit in parenthesis): Year (1, 2, 3), Hospital (A, B, C), Unit (S, M, G) and Expense (NOK per patient day).
Task:
The supervisory body for the hospitals in a county wants to see if there are systematic differences between the hospitals and its units and over the years, or whether the differences may just as well be due to chance. In that case there is no reason to make fuzz about the observed differences.
Version A:
You are assigned to the task, and decide to try out the different estimating and testing procedures you learned at school, among them analysis of variance.
Version B:
Consider first the data in the first table which disregard the hospital unit.
(a) Assume a constant yearly expected expense level within each hospital, and consider the data for the three years in the table as independent observations of the expenses. Estimate the expected expenses and test whether there are systematic differences between them. Is sufficient evidence that any hospital has lower expected expense than the others?
(b) Repeat the testing in (a) under the assumption of a general yearly level difference in expenses. Test also whether there are systematic yearly differences. Is the independence assumption in (a) warranted?
(c) Give reasons why the analysis in (b) may be misleading.
Now consider the expenses taking the hospital unit into account as well.
(d) Make a two-way table for mean expenses for hospital vs. unit similar to the first table given Exhibit by suitable graphs. Do you find support for the conclusion in (c)?
What kind of analysis can overcome this?
(e) Perform such analyses under different assumptions where we have the opportunity the test whether there are systematic differences between (i) hospital (ii) units (iii) years.
(f) To what extent are we able to check whether the standard assumptions for this kind of analysis are fulfilled? | nb_NO |