| dc.description.abstract | Topic: Estimation with confidence, t-tests
Context:
The city parking company of Bergen, Norway had in the period 1983-1988 two shifts for emptying the parking meters and ticket machines. The two shifts were alternating on a weekly basis, such that shift 1 had this job in odd numbered weeks and shift 2 in even numbered weeks. Each shift had three teams. The teams as well as the routines were fixed in the period down to week 42 in 1988, and collected money at the end of the week was counted and the settlement entered in the books with no split on teams. The parking rates were increased 1.1.1984, 1.1.1987 and 1.1.1988. A reduction in the number of street parking meters took place 30.6.1984, when a large city garage opened. Small changes in street parking took place in the year afterwards, among others due to replacement of some parking meters by ticket machines. The available data consists of 149 settlements for each of the two shifts. Some weeks are lacking because of a strike and some other circumstances that will not affect the analysis.
In 1987 the management was warned that the equipment for emptying the meters had a weakness and that there were rumours that some employees had taken the opportunity to siphon off money for themselves. Some said these rumours were around already in 1984.
The available data are stored in file City_Parking.XLS
Task:
Imagine you are a member of the management team and responsible for analyzing the available data to see whether it is worthwhile to start further investigation. It is regarded very unfortunate for the working climate within the company if management confronts the teams with their suspicion and it turns out that there is nothing to it. The decision to stage further investigation should therefore be made if statistics shows beyond reasonable doubt that money is lacking. Suppose that the suspicion is strengthened by the analysis, but you are not sure whether one, two or all three work teams in shift 2 are involved. How could routines be modified to be able to reveal this?
In case that fraud is admitted, but far less than the data indicate, it is of interest to both estimate the most likely embezzled amount and a lower limit beyond reasonable doubt.
A-version:
You have no guidance on how to proceed, except what you have learned at school.
B-version:
You follow the telephonic guidance of a friend on how to proceed (see next page).
Task (B-version):
Your friend on the telephone recommends the following:
(a) You should first look at the data file to see if there may be observations or lack of observations that may affect the subsequent analysis. In what follows you should see if corrections or modifications are required, or whether the data problems really matters for the conclusion and the intended use of the results.
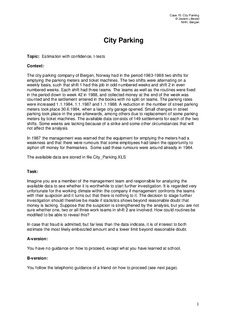
(b) Provide a time series plot of the amount per collection for each shift over the period 1983-1988. Interpret the plot and remember special features that may affect the subsequent analysis. Reflect on the possibilities of differences not linked to fraud. Also reflect on the best way to plot the data to expose differences between the shifts.
(c) Compute the average amount collected by the two shifts for the entire period 1983-1988. You may perform a two-sample t-analysis to test the hypothesis of no difference and at the same time obtain a confidence interval for the mean, which can be projected to the total. You should examine whether the assumptions for the analysis are justified. If not, you should look for alternatives.
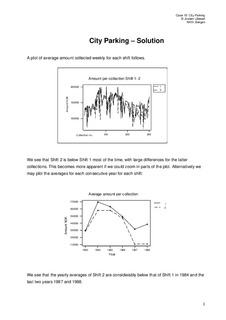
(d) Go on to examine each year separately. Compute average amounts for both shifts for each year. You may perform separate two-sample t-analysis for each year. You should test the hypotheses of no difference as well as try to compute confidence interval for the total amount.
(e) Some further possibilities are:
- a two-factor analysis of variance (ANOVA), the two factors being shift and year,
- analyze suitable paired observation from the two shifts,
- analyze departures from a moving average smoothing of the time series
(f) You have to judge whichever approach is better, and whether some improvements could be made. | nb_NO |